How have the Bills done so far?
During the Sean McDermott era, the Buffalo Bills have typically trended toward higher penalty volumes. This offseason they hired former NFL official John Parry to help consult on rules and such.
Sure, the idea when it was announced centered around more game day conversations about what to challenge and such. But a more penalty-aware culture may be paying dividends in keeping the laundry at bay, right? Right?
I have no idea actually, but I usually do a bye-week recap and here we are. The Parry angle is just one more wrinkle in tradition.
Buffalo Bills 2024 weekly penalty tracker charts
You’re likely familiar with these as the penalty recaps have a core audience, so I won’t take the time to explain the “what” all that much and jump right into trends.
Weekly Counts

Just in case there are any new readers, count reflects flags assessed on the field, whereas true count reflects all flags (including declined and offset). The Bills have had a roller coaster of a season deviating from a one-flag game against the Miami Dolphins (Week 2) and a 17-flag affair against the Seattle Seahawks.
As a note on the latter game, most places call it 16 total. That was the game that invoked the rare 5-yard vs. 15-yard rule, in which one of Buffalo’s flags was “superseded” and not officially recorded by the league. Since I look at all trends, I included it.
We’ll talk averages and comparisons in a bit, but for now let’s just soak in the chaos.
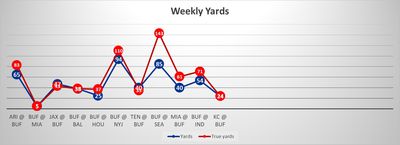
Weekly Yards

Here yards are as expected. True yards factors in yards impacted by penalty. I say “impacted” rather than “negated” as a deliberate term. For instance, against the Tennessee Titans a defensive offside from Greg Rousseau occurred on a five-yard Titans gain. Tennessee accepted the flag and lost their yardage, so from a yards perspective it was a wash and why the red bubble is lower than the blue for that game.
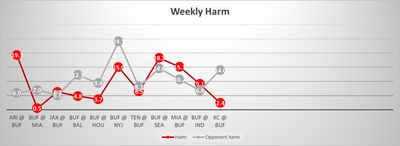
Weekly Harm

For our Harm tracker, this compares to Buffalo’s weekly opponent as it’s a proprietary metric and there’s no way to look at data for opponents except here. For any new readers, Harm looks at impacted yards, downs, points, etc. to assign a rating on how likely a penalty was to have had a significant impact on the game.
Across an entire game, the rule of thumb is to try and avoid amassing 10.0 Harm or higher, which is a good item to keep in the back of your head when reading the chart. It’s also nice when the gray bubble is higher than the red one. As expected, Buffalo’s roller coaster is also reflected here. They cross the 10.0 line five times but you may notice that it doesn’t correlate with wins/losses well.
How do Buffalo Bills’ penalties compare to 2024 NFL averages?
On a per game basis, the Bills are assessed with 6.18 flags per game, which is 15th in the league. At 7.09 total flags per game, Buffalo is 13th best. When it comes to yardage assessed per game, Buffalo loses 47 yards per game. That’s 10th best in the league. Translating that data, overall it means Buffalo is average. It also means that the Bills steer a little toward boo-boo flags as their yardage ranking is several places better than their assessed count.
For league averages, a typical team could expect 6.36 flags per game, a negligible difference from Buffalo. The range here is between 8.36 (Baltimore Ravens) and 4.64 (Arizona Cardinals).
For total flags, the average is 7.53 flags per game. The bird-themed teams I just mentioned are still the extremes at 10.00 and 5.00 respectively.
When it comes to yards, teams average 51.14 yards per game — which is also pretty close to Buffalo’s average. The range still starts with Baltimore at 69.36 yards per game, but the Cincinnati Bengals take the top spot with 37.64 per game. Arizona falls all the way to sixth if you’re curious, with 43.36 yards per game.
I’ll put a disclaimer before this next comparison. Flags tend to fall as the year progresses and there’s still plenty of 2024 to play. That said, I’ve seen even more lamentations on flags this season than years past so the question is if they’re really higher. Last season ended with:
- 5.67 flags assessed per game
- 6.72 flags thrown per game
- 46.73 yards per game
For this conversation I’m going to focus just on the flags thrown per game. Whether it’s decline/offset or not, every flag is an interruption and this is what fans would perceive. If the 2024 rates hold, you’d be looking at a difference of 0.81 flags per team per game. Or put differently, for the viewers at home that’s 1.6 more flags per game than last year. That’s certainly more and possible even enough to notice, but I’ll reiterate the disclaimer from above. We still have six weeks to go plus the playoffs and that number should fall a bit.
How do the Buffalo Bills’ penalties compare to past years?
League averages are fun, but how are the Bills trending themselves? As of right now, not really any better than they have been. In 2023 they averaged 5.95 assessed per game and 6.84 total. Those are both slightly under the current 2024 rate.
The 2022 season was a bit odd. The Bills had 5.67 assessed and 7.17 total, which is a pretty good gap between the two numbers. 2021 was a bad year for Buffalo with 6.26 assessed and 7.68 total.
I’ll note the disclaimer from above here as well. All of the prior years include a full season and playoff results. It’s possible the end-of-year numbers for the Bills will look better than they do now in comparison to prior years.
Buffalo Bills Most Wanted
If you’re here, you like data. So make sure to view in the desktop version and rejoice in the sortable table.